Techma Zone Institute Analytics Dashboard
- Python
- Pandas
- Power BI
- DAX
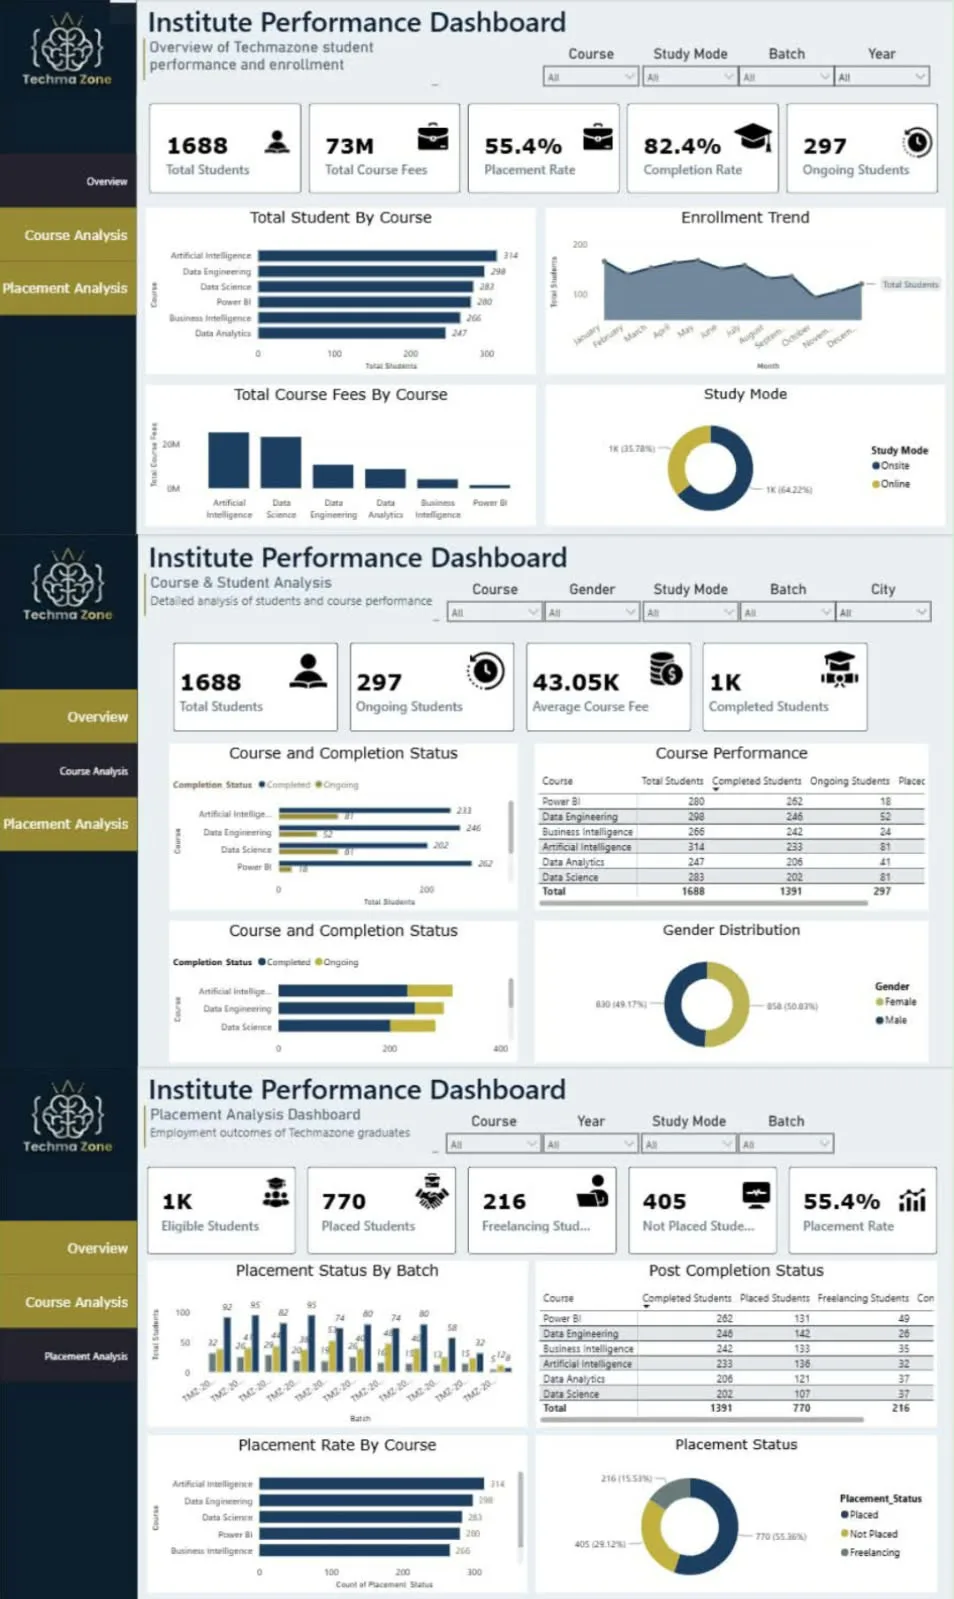
A student analytics project based on a simulated dataset of 1,500 student records covering attendance, grades, enrollment, and course completion.
𝗧𝗲𝗰𝗵𝗺𝗮 𝗭𝗼𝗻𝗲 𝗔𝗻𝗮𝗹𝘆𝘁𝗶𝗰𝘀 & 𝗣𝗹𝗮𝗰𝗲𝗺𝗲𝗻𝘁 I recently wrapped up a end-to-end Business Intelligence project analyzing student lifecycle performance and job placement distribution. 𝗧𝗲𝗰𝗵𝗻𝗶𝗰𝗮𝗹 𝗔𝗿𝗰𝗵𝗶𝘁𝗲𝗰𝘁𝘂𝗿𝗲 & 𝗙𝗲𝗮𝘁𝘂𝗿𝗲𝘀: 𝗗𝗮𝘁𝗮 𝗠𝗼𝗱𝗲𝗹𝗶𝗻𝗴: Cleaned and structured relational tables combining enrollment history, demographic data, fee structures, and post-graduation outcomes. 𝗗𝗔𝗫 𝗙𝗼𝗿𝗺𝘂𝗹𝗮𝘀: Developed custom measures for dynamic KPI cards (Completion Rate %, Placement Rate %, Total Revenue, and Freelancer counts). 𝗨𝗜/𝗨𝗫 & 𝗡𝗮𝘃𝗶𝗴𝗮𝘁𝗶𝗼𝗻: Implemented a dark custom sidebar menu for intuitive page switching between Overview, Course Analysis, and Placement Analysis. 𝗗𝘆𝗻𝗮𝗺𝗶𝗰 𝗦𝗹𝗶𝗰𝗲𝗿𝘀: Enabled cross-filtering by Course, Gender, Study Mode, Batch, Year, and City for granular slice-and-dice capability. 𝗧𝗼𝗽 𝗣𝗿𝗼𝗷𝗲𝗰𝘁 𝗜𝗻𝘀𝗶𝗴𝗵𝘁𝘀: Total Students: 1,688 Completion Rate: 82.4% Placement Rate: 55.4% Top Enrolled Field: Artificial Intelligence (314 students)