Starbucks Nutritional Data Analysis Dashboard
- Power BI
- Power Query
- Data Modeling
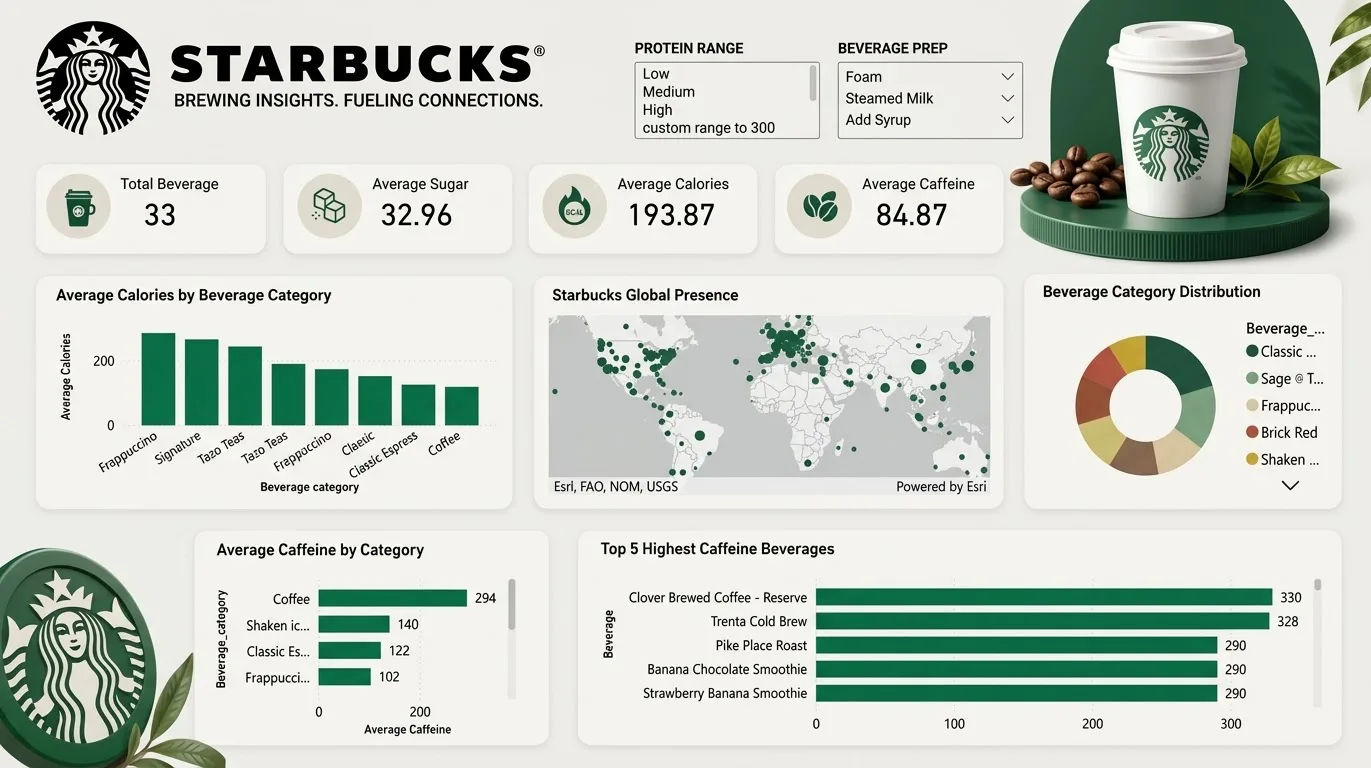
A data analysis and visualization project focused on exploring nutritional information across Starbucks beverages.
An interactive Power BI dashboard designed to analyze nutritional profiles, caffeine content, and spatial distribution across Starbucks' menu offerings and global store network. Key Features Key Performance Indicators (KPIs): Instant visibility into total beverage count (33), average calorie intake (193.87 kcal), average sugar content (32.96 g), and average caffeine levels (84.87 mg). Nutritional Breakdown: Bar and donut charts categorizing beverages by average calories, caffeine, and category distribution. High-Caffeine Highlights: Top 5 highest-caffeine beverages highlighted, led by Clover Brewed Coffee - Reserve (330 mg) and Trenta Cold Brew (328 mg). Global Presence Map: Spatial visualization highlighting retail distribution across global markets. Dynamic Filtering: Slicers allowing users to filter menu items by protein ranges and beverage preparation preferences (foam, steamed milk, syrup). Tools Used Visualization: Power BI / Esri ArcGIS Maps Data Processing: Excel / Power Query