E-Commerce Performance & Return Analytics
- Power BI
- Excel
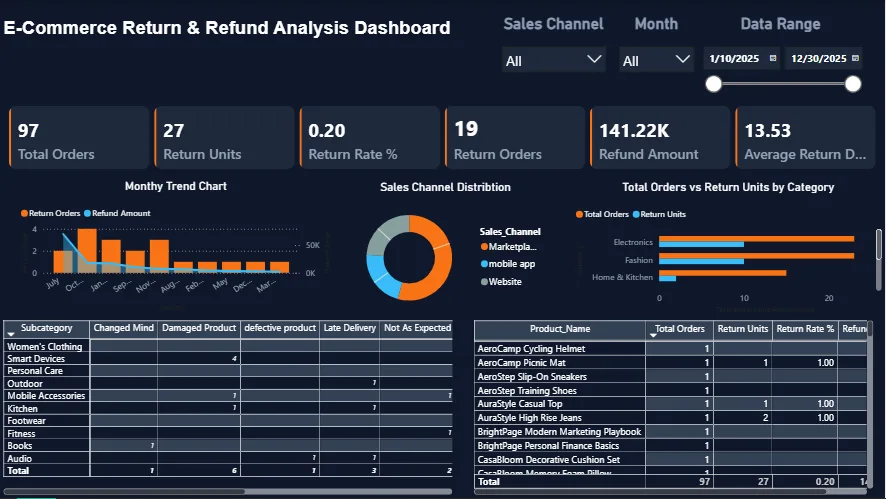
An interactive dashboard focused on understanding e-commerce sales performance and product return patterns.
E-Commerce Return & Refund Analysis Dashboard My Power BI project focused on analyzing e-commerce return metrics to help reduce revenue leakage and improve customer satisfaction. Understanding why products are returned is key to optimizing supply chain operations and product quality. This dashboard provides a consolidated view of return trends, categories, and key drivers. Key Dashboard Metrics: Total Orders Analyzed: 97 Returned Units: 27 Return Rate: 0.20% Total Refund Amount: $141.22K Key Features & Insights: Monthly Trend Chart: Tracks return volume against refund amounts to identify seasonal peaks. Sales Channel Breakdown: Analyzes return distributions across Marketplace, Mobile App, and Website channels. Category Breakdown: Highlights high-volume return categories like Electronics and Fashion. Return Reason Matrix: Maps subcategories against primary return drivers (e.g., Damaged Product, Late Delivery, Defective Product, Not As Expected) to pinpoint root causes. Product-Level Detail Table: Evaluates individual item performance and return rates for targeted inventory decisions. Tools Used: Power BI | Data Modeling | Data Visualization | DAX