Blinkit Sales & Outlet Analytics Dashboard
- Power BI
- Power Query
- DAX
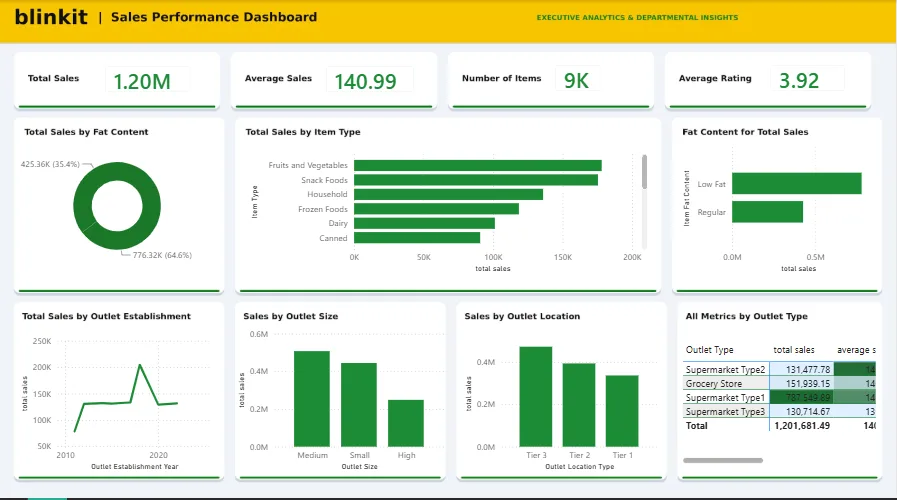
An interactive sales analytics dashboard designed to explore revenue, outlet performance, product categories, and product fat-content metrics.
My Power BI project: an interactive Sales Performance Dashboard for Blinkit! 📊🛒 As part of my journey in data analytics, I designed this dashboard to transform raw sales data into actionable retail insights. Highlights: Total Revenue: $1.20M across 9K items Top Item Categories: Fruits & Vegetables, Snack Foods, and Household items Dominant Store Types: Tier 3 locations and Medium-sized outlets generated the highest revenue share